Rating storms: 1 (weak), 5(uh-oh)
By Paul Rogers
progers@bayareanewsgroup.Dcom
They are giant conveyor belts of water in the sky, moisture-rich storms that roll in from the Pacific Ocean a few times a year to fill California’s reservoirs, blanket the Sierra Nevada with snow and sometimes cause deadly flooding and mudslides.
But distinguishing a good atmospheric river storm — a modest one that can help end a drought — from a catastrophic one that can kill people has been elusive. Today, that changed, as scientists published the first-ever scale to rank the strength and impact of incoming atmospheric rivers, similar to the way hurricanes are classified.
Under the system, the storms, known as “pineapple express” events when they originate near Hawaii, will be categorized from 1 to 5, based on the amount of moisture they carry and the number of hours they are expected to linger over land.
Under the new scale, 1 is a relatively weak, beneficial storm that will replenish rivers and reservoirs, while 5 is an exceptional and dangerous storm, similar to the February 2017 event that led to the failure of the spillway at Oroville Dam and caused more than $100 million in flood damage to downtown San Jose residents.
“If there’s an atmospheric river coming, is it going to be a big scary one or a helpful one? The scale can help answer that ques-
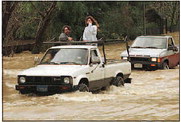
Two trucks cross a flooded road in Guerneville in Sonoma County in 1997. That storm, which killed at least 14, would now be considered an Atmospheric River Category 5 storm.
GETTY IMAGES
tion,” said Marty Ralph, director of the Center for Western Weather and Water Extremes at UC San Diego.
Ralph, one of the nation’s experts on atmospheric river storms, is the lead author of the new paper, which was published today in the Bulletin of the American Meteorological Society.
Until a few years ago, even scientists disagreed on which storms could be defined as atmospheric rivers. Having a standard system to compare atmospheric river storms and put them in context will help emergency officials, water managers and the public better prepare, he said.
On Friday, Ralph’s team was among of a group of researchers who flew in two C-130 planes into an atmospheric river storm as it was heading for Southern California, to measure the storm’s properties. That storm drenched Santa Barbara with 6 inches of rain in 72 hours and 10 inches in the mountains east of Los Angeles.
Ralph noted that several National Weather Service staff members are part of the group who published the paper today, and that he hopes government meteorologists and TV weather forecasters will begin to use the scale.
“I anticipate that this scale will be adopted and highly used,” said Jon Rutz, a meteorologist with the weather service who co-authored the study.
State officials in California who are charged with water supply and flood control said they are watching closely.
“It’s nice that we are now able to quantify atmospheric rivers like other big weather events,” said Chris Orrock, a spokesman for the California Department of Water Resources. “When we talk about hurricanes most people understand the categories.
“Now, when an atmospheric river is coming, people can say ‘OK, it’s similar to what happened in 1985 or 2012,’ ” he added. “Knowing what the potential is helps us to prepare better.”
In a typical year, atmospheric river storms occur about 10 to 15 times in California. But they account for up to 50 percent of the state’s precipitation.
Although they are flowing in the sky up to 2 miles above the ocean, they are the biggest “rivers” on Earth. The largest atmospheric river storms carry twice the volume of water per second as the Amazon River, and 25 times the volume of the Mississippi River where it flows into the ocean.
When high-pressure ridges block the rivers, California can enter a drought. When they make it to landfall, the rain can be substantial: 92 percent of the wettest three-day rain events on the West Coast in one study were linked to atmospheric rivers. And 81 percent of Central Valley levee breaks occurred during them.
The new scale ranks atmospheric rivers as follows:
• Category 1 (Weak): Primarily beneficial. For example, a Feb. 23, 2017, atmospheric river storm hit California, lasted 24 hours at the coast, and produced modest rainfall.
• Category 2 (Moderate): Mostly beneficial, but also somewhat hazardous. An atmospheric river on Nov. 19-20, 2016, hit Northern California, lasted 42 hours at the coast, and produced several inches of rain that helped replenish low reservoirs after a drought.
• Category 3 (Strong): Balance of beneficial and hazardous. An atmospheric river on Oct. 14-15, 2016, lasted 36 hours at the coast, produced 5-10 inches of rain that helped refill reservoirs after a drought, but also caused some rivers to rise to just below flood stage.
• Category 4 (Extreme): Mostly hazardous, but also beneficial. For example, an atmospheric river on Jan. 8-9, 2017, that persisted for 36 hours produced up to 14 inches of rain in the Sierra Nevada and caused at least a dozen rivers to reach flood stage.
• Category 5 (Exceptional): Primarily hazardous. For example, a Dec. 29, 1996, to Jan. 2, 1997, atmospheric river lasted more than 100 hours at the Central California coast. The associated heavy precipitation and runoff caused more than $1 billion in damage.
Contact Paul Rogers at 408- 920- 5045.
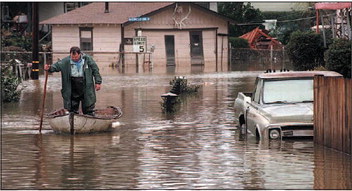
Ron Colvin navigates along flooded Beach Drive on Ida Island in the Sacramento River. The January 1997 storm would now be considered an Atmospheric River Category 5 storm.
STAFF FILE PHOTO